La conveniencia de incorporar a Rusia y Turquía a la Unión Europea – Parte II (página 5)
•Cadastral renovation was completed for 1 million parcels and more than 115,000 square kilometers of ortophoto maps (aerial photographs that are corrected so that the scale is uniform and the photos have the same lack of distortion as a map) were produced.
Country and regional perspectives (WEO – FMI)
October 2014
Turkey


Country Statistical Profiles: Key Tables from OECD – © OECD 2014


OECD Economic Surveys: Turkey 2014
Executive summary


Invest in Turkey
(Fuente: Investment Support and Promotion Agency – www.invest.gov.tr – 2014)
PIB | 820.000 millones de dólares (2013 – precios actuales) |
PIB per cápita | 10.782 dólares (2013) |
Valor de las exportaciones | 152.000 millones de dólares (2013) |
Valor de las importaciones | 251.000 millones de dólares (2013) |
Ingresos por turismo | 32.300 millones de dólares (2013) |
Número de turistas | 39,2 millones (2013) |
Inversión extranjera directa | 12.900 millones de dólares (2013) |
36.450 (2013) | |
Tasa de inflación | 7,5 % (IPC – 2013) |
Principales mercados de exportación | Alemania (9%); Iraq (7,8%); Reino Unido (5,8%); Rusia (4,6%); Italia (4,4%); Francia (4,2%); EE. UU. (3,7%); EAU (3,3%); España (2,8%); Irán (2,4%) (2013) |
Principales fuentes de importación | Rusia (9,9%); China (9,8%); Alemania (9,6%); Italia (5,1%); EE. UU. (5%); Irán (4,1%); Suiza (3,8%); Francia (3,2%); España (2,5%); India (2,5%) (2013) |
Acuerdos comerciales |
|
10 motivos para invertir en Turquía
1. Una economía de éxito
El buen ritmo de la economía: el PIB ascendió a más del triple, alcanzando en 2013 los 820.000 millones de dólares desde los 231.000 millones en 2002 (TurkStat)
Un crecimiento económico estable con un índice de incremento medio real del PIB del 5,1 por ciento anual durante la última década (TurkStat)
Economía prometedora y con un futuro esplendoroso que se espera que se convierta en la que más rápido crezca de todos los miembros de la OCDE durante el periodo 2012-2017, con una tasa media de crecimiento del PIB real anual del 5,2 por ciento (OECD Economic Outlook No. 91)
Decimosexta mayor economía del mundo y la sexta mayor en comparación con la UE en 2013 (según el PIB ajustado a la PPA, IMF WEO)
Economía institucionalizada e impulsada por un IED por valor de 135.000 millones de dólares en la última década (Banco Central de la República de Turquía)
Un sector privado dinámico y maduro con un valor de 152.000 millones de dólares de exportaciones y un aumento del 245 por ciento entre 2004 y 2013 (TurkStat)
2. Su población
Una población de 76.7 millones de personas (2013, TurkStat)
La población más joven en comparación con la UE (Eurostat)
La mitad de la población es menor de 30,4 años (2013, TurkStat)
Población joven, dinámica, formada y multicultural
3. Una mano de obra cualificada y competitiva
Más de 28,3 millones de jóvenes profesionales, formados y motivados (2013, TurkStat)
Mayor productividad laboral
Unos 610.000 estudiantes graduados anualmente en más de 183 universidades (2012, Student Selection and Placement Center-OSYM)
Más de 700.000 personas finalizan el instituto, de los cuales aproximadamente la mitad en institutos de formación profesional y técnica (2012, TurkStat)
4. Un clima de inversión liberal y reformista
El segundo mayor en reformas de entre los países de OECD en lo referente a sus restricciones sobre IED desde 1997 (OECD FDI Regulatory Restrictiveness Index 1997-2012)
Un entorno empresarial favorable con una media de 6 días para fundar una empresa, mientas que la media entre los miembros de la OCDE es de más de 11 días (informe Doing Business del Banco Mundial, 2014)
Condiciones de inversión muy competitivas
Cultura industrial y de servicios sólida
Trato igualitario a todos los inversores
Alrededor de 36.950 empresas con capital internacional en 2013 (Ministerio de Economía)
Arbitraje internacional
Garantía de transferencias
5. Su infraestructura
Una infraestructura tecnológica nueva y muy desarrollada para el transporte, las telecomunicaciones y la energía
Instalaciones de transporte marítimo baratas y muy desarrolladas
Ventajas en el transporte ferroviario a Europa del Este y Central
Rutas de transporte establecidas y mecanismo de entrega directa a la mayoría de los países de la UE
6. Su ubicación central
Un puente natural que comunica el norte con el sur y oriente con occidente, lo cual permite acceder a los mercados más importantes de forma eficiente y rentable
Fácil acceso a 1.500 millones de consumidores de Europa, Eurasia, Oriente Próximo y África del Norte
Acceso a varios mercados que suman 25 billones de dólares de PIB
7. Corredor y punto de conexión de energía de Europa
Un corredor y punto de conexión de la energía en Europa que vincula Oriente y Occidente
Próximo a más del 70% de los recursos energéticos mundiales conocidos, y el mayor consumidor de energía, Europa, se ubica al oeste de Turquía, convirtiendo al país en un eje del tránsito de energía y una terminal energética en la región.
8. Impuestos reducidos e incentivos
Impuesto sobre la renta de sociedades reducido del 33 al 20%
Las ventajas fiscales y los incentivos en las Zonas de Desarrollo Tecnológico, Zonas Industriales y Zonas Francas podrían contemplar la exención parcial o total del impuesto sobre la renta de sociedades, una subvención para los gastos en seguridad social de las empresas y la asignación de terrenos
Ley de apoyo a la innovación y a I+D
Incentivos a la inversión estratégica dirigida a disminuir las importaciones, para inversiones a gran escala, así como para inversiones regionales
9. Unión aduanera con la UE desde 1996
Unión aduanera con la UE desde 1996 y acuerdos de libre comercio (ALC) con 20 países (Ministerio de Economía)
Negociaciones en marcha para establecer más ALC
Negociaciones para la adhesión a la UE
10. Un gran mercado interno
32,6 millones de abonados a Internet de banda ancha en 2013, frente a 0,1 millones de 2002 (ICTA, TurkStat)
69,6 millones abonados a línea móvil en 2013, frente a los 23 millones de 2002 (TurkStat)
57 millones de usuarios de tarjetas de crédito en 2013 (frente a los 16 millones de 2002 (Centro Interbancario de Tarjetas de Turquía)
131 millones de usuarios de aerolíneas en 2012, frente a los 33 millones de 2002 (TurkStat)
39,2 millones de llegadas de turistas internacionales en 2012, frente a los 13 millones de 2002 (TurkStat)
Comercio exterior
En 2012, las exportaciones de Turquía alcanzaron su máximo histórico con un total de 152.500 millones de dólares, lo que representa un incremento del 13 por ciento.
Estadísticas de comercio exterior
Millones de dólares | |||||||
| 2006 | 2007 | 2008 | 2009 | 2010 | 2011 | 2012 |
Exportaciones (FOB) | 85.535 | 107.272 | 132.002 | 102.143 | 113.883 | 134.969 | 152.462 |
Importaciones (CSF) | 139.576 | 170.063 | 201.961 | 140.929 | 185.544 | 240.838 | 236.545 |
Volumen de comercio | 225.111 | 277.334 | 333.963 | 243.072 | 299.428 | 375.807 | 389.007 |
Balance de comercio | -54.041 | -62.791 | -69.959 | -38.786 | -71.661 | -105.869 | -84.083 |
Source: TurkStat
Debido a la implementación del proceso de liberalización comenzado en 1980, la economía turca ha experimentado un periodo de gran crecimiento. El comercio exterior, tanto en lo relativo a las exportaciones como a las importaciones, ha crecido con gran rapidez. Por otra parte, se han observado cambios significativos en la estructura de las exportaciones. A este respecto, los productos industriales han cobrado una mayor importancia frente a los productos agrícolas.
En 1995, Turquía entró a formar parte de la Organización Mundial del Comercio (OMC), tras lo cual suscribió un acuerdo con la Unión Europea que le permitió incorporarse a la Unión Aduanera el 1 de enero de 1996.
Exportaciones
De acuerdo con las políticas puestas en marcha en el marco de un modelo de desarrollo impulsado por las exportaciones desde 1980, la exportación es un factor importante para Turquía tanto en términos de calidad como en términos de cantidad. Principalmente a partir de 1980 y hasta mediados de la década de los noventa, se han observado grandes progresos en la cuota de mercado representada por los productos industriales fabricados fundamentalmente a partir del capital humano, como son los tejidos y las prendas de vestir, el hierro y el acero y los comestibles. Con el establecimiento de una Unión Aduanera con la Unión Europea en 1996, las exportaciones de Turquía comenzaron un nuevo proceso de transformación estructural. El desarrollo de los últimos años muestra que la producción y las exportaciones han crecido sustancialmente en los sectores de la alta tecnología, que abarcan maquinaria y equipos electrónicos y eléctricos, y la industria de la automoción. Por otra parte, también se puede advertir que la cuota de mercado de las exportaciones de productos industriales manufacturados se ha incrementado.
Los 10 grupos de productos con más exportaciones en el 2012
| Grupos de productos | Millones de dólares | Porcentaje de las exportaciones totales | ||||||||||||||||
1 | Piedras preciosas, metales preciosos, perlas y artículos derivados | 16,3 | 10,7 | ||||||||||||||||
2 | Vehículos, excepto material rodante de ferrocarriles y tranvías, y sus partes | 15,2 | 10,0 | ||||||||||||||||
3 | Calderas, máquinas y aparatos mecánicos; partes de estas máquinas o aparatos | 12,0 | 7,8 | ||||||||||||||||
4 | Hierro y acero | 11,3 | 7,4 | ||||||||||||||||
5 | Maquinaria y equipos eléctricos: sus partes | 9,4 | 6,2 | ||||||||||||||||
6 | Artículos y complementos de punto | 8,4 | 5,5 | ||||||||||||||||
7 | Combustibles minerales, aceites minerales y sus destilados | 7,7 | 5,0 | ||||||||||||||||
8 | Artículos de hierro y acero | 6,1 | 4,0 | ||||||||||||||||
9 | Artículos y accesorios de vestir, excepto los de punto | 5,4 | 3,5 | ||||||||||||||||
10 | Plástico y artículos de plástico | 5,0 | 3,2 | ||||||||||||||||
Source: TurkStat
Mercados principales de exportación en 2012
Mercados | Millones de dólares | Cuota (%) | ||||
A-EU 28 | 59.399 | 38,9 | ||||
B-Zonas francas de Turquía | 2.295 | 1,5 | ||||
C-Otros países | 90.769 | 59,5 | ||||
1- Otros países europeos | 14.167 | 9,2 | ||||
2- Otros países del Norte de África | 9.444 | 6,1 | ||||
3- Otros países africanos | 3.913 | 2,6 | ||||
4- Otros países del Norte de América | 6.663 | 4,4 | ||||
5- América Central y el Caribe | 770 | 0,5 | ||||
6- Países de América del Sur | 2.191 | 1,4 | ||||
7- Países del Oriente Próximo y Medio | 42.452 | 27,8 | ||||
8- Otros países asiáticos | 10.575 | 6,9 | ||||
9- Australia y Nueva Zelanda | 490 | 0,3 | ||||
10- Otros países | 105 | 0,0 | ||||
Fuente: TurkStat
Importaciones
El régimen de importaciones de Turquía destaca la liberalización de las importaciones de este país en armonía con sus compromisos para completar la Unión Aduanera con la UE, su relación con la AELC y las responsabilidades impuestas por la Organización Mundial del Comercio (OMC). Turquía ha concedido especial importancia a su compromiso de reducción de derechos de aduana con la finalidad de alinearse con el arancel aduanero común. Además, ha realizado modificaciones necesarias en su régimen de importaciones, tras lo cual, el 1 de enero de 1996, la Unión Aduanera con la UE entró en vigor.
Los principales objetivos de la política de importación de Turquía desde principios de la década de los ochenta se pueden sintetizar del siguiente modo:
Reducción de las medidas proteccionistas de conformidad con la nueva normativa GATT
Reducción de los trámites burocráticos
Garantía de suministro de materias primas y bienes intermedios a precios asequibles y sujetos a ciertas normas de calidad
Pertenencia de Turquía a organizaciones comerciales internacionales
Turquía forma parte de la Organización Mundial del Comercio (OMC) desde 1995. Su compromiso de integración de las normas de comercio regionales e internacionales ha cristalizado en la participación del país en diversas organizaciones, entre las que destacan la Organización de Cooperación Económica (ECO), la Conferencia de las Naciones Unidas sobre Comercio y Desarrollo (CNUCD), la Organización de la Cooperación Económica del Mar Negro (BSEC), la Organización Mundial de Aduanas (OMA), la Cámara de Comercio Internacional (CCI) y la organización D-8.
Además de la Unión Aduanera con la UE, Turquía ha suscrito acuerdos de libre comercio (ALC) con Islandia, Noruega, Suiza y Lichtenstein, Georgia, Israel, la antigua República Yugoslava de Macedonia, Croacia, Bosnia-Herzegovina, Túnez, Marruecos, la Autoridad Palestina, Siria, Egipto, Albania, Montenegro, Serbia, Chile, Jordania , junto con el Líbano, las Islas Mauricio y Corea del Sur, que esperan la ratificación.
Indicadores macroeconómicos
Crecimiento económico
Unas políticas económicas sólidas, junto con unas reformas económicas intensas, han producido resultados favorables: la economía ha experimentado un fuerte crecimiento económico durante los últimos ocho años. Gracias a las reformas estructurales y a las beneficiosas políticas macroeconómicas implementadas con decisión, Turquía se ha convertido en una de las economías de más rápido crecimiento de la región.
Estabilidad y alto rendimiento en la economía
Entre 2002 y 2011:
Con un aumento del 234%, el PIB alcanzó los 772 000 millones de dólares
El PIB real medio anual creció en un 5,2%
El nivel de endeudamiento público descendió del 74% al 39,4% del PIB
El déficit presupuestario bajó del 10% hasta menos del 3% del PIB
Tasa media de crecimiento anual (TMCA) del PIB (%) (a precios constantes)

Fuente: Instituto de Estadística de Turquía (TurkStat)
En los últimos ocho años, la economía turca ha sido una de las economías emergentes que más rápido ha crecido.
Tasa media de crecimiento anual del PIB real (%) 2002-2011

Fuente: Perspectivas de la Economía Mundial del FMI, abril de 2012; Instituto de Estadística de Turquía (TurkStat)
Turquía ha sido la economía que más rápido ha crecido en Europa y una de las de más rápido crecimiento a nivel mundial en 2010 y 2011.
Crecimiento del PIB real (%)
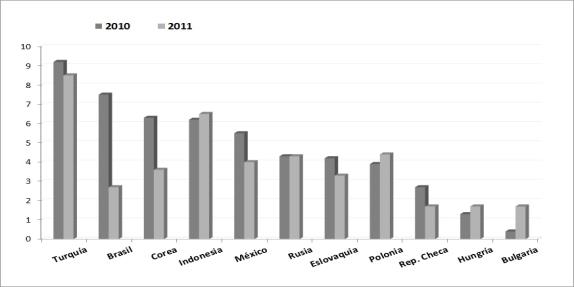
Fuente: Perspectivas de la Economía Mundial del FMI, abril de 2012; Instituto de Estadística de Turquía (TurkStat)
A medida que la economía turca ha ido creciendo de forma constante, el nivel de vida también ha aumentado de forma significativa. El PIB per cápita pasó de 3.492 dólares en 2002 a 10.444 dólares en 2011.
PIB per cápita: precios actuales (dólares)
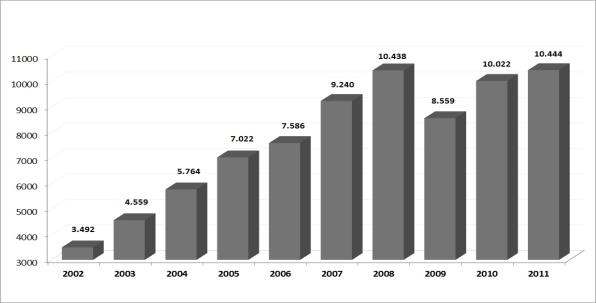
Fuente: Instituto de Estadística de Turquía (TurkStat)
PIB de 2011: precios actuales (miles de millones de dólares)

Fuente: Perspectivas de la Economía Mundial del FMI, abril de 2011
Política fiscal prudente
La disciplina fiscal continúa siendo la clave de los resultados macroeconómicos de la economía turca.
Gracias a su prudente política fiscal, Turquía ha disminuido su nivel de endeudamiento y se ha convertido en una de las economías europeas de mejor rendimiento en lo que a reducción de deuda pública se refiere. El porcentaje de deuda pública general cumple el criterio de Maastricht de la UE, un 60%, desde 2004.
Deuda pública general definida por la UE (% del PIB)

Fuente: Subsecretaría de Hacienda
Deuda pública general de 2011 (% del PIB)

Fuente: Subsecretaría de Hacienda y Eurostat
Balance presupuestario del gobierno definido por la UE (% del PIB)

Fuente: Dirección General de Asuntos Económicos y Financieros de la Comisión Europea (ECFIN)
Balance presupuestario general del gobierno en 2011 (% del PIB)

Fuente: Dirección General de Asuntos Económicos y Financieros de la Comisión Europea (ECFIN) y Eurostat
Estadisticas del comercio internacional 2014 OMC – http://www.wto.org/spanish/res_s/statis_s/its2014_s/its14_toc_s.htm


World Bank Group – Turkey Partnership: Country Program Snapshot
October 2014
Recent economic and sector developments
Growth and Economic Management
Turkey has experienced important gains in income and living standards over the past decade. Turkey"s GDP tripled in nominal U.S. dollar terms between 2001 and 2007 and today Turkey is an upper-middle-income country with a population of 76 million and a GDP of US$ 820 billion, making it the 18th-largest economy in the world. Turkey is a European Union (EU) accession candidate country, a member of the Organisation for Economic Co-operation and Development (OECD) and the G20, and an increasingly important donor to bilateral Official Development Assistance (ODA). Turkey is also one of the largest middle-income partners of the World Bank Group.
Turkey"s rapid economic and social progress holds many useful lessons for policy makers in other emerging markets and has been an inspiration to reformers, particularly in the Middle East and North Africa. Turkey"s success in spreading the benefits of economic growth to its population is particularly noteworthy. Extreme poverty fell from 13 percent to 5 percent while moderate poverty fell from 44 percent to 20.6 percent between 2002 and 2012. Since the trough of the recession in 2009, Turkey has created some 5.7 million jobs, which has kept unemployment below 10 percent as of July 2014, despite rapid increases in labor force participation, including among women. Over the past decade, Turkey"s growing prosperity has been shared; although inequality remains higher than in many European countries, it is still lower than in all Latin American countries.
After the post-crisis rebound in 2010-11, economic growth in Turkey has moderated, with rising concerns over persistent external imbalances. Following the "soft landing" in 2012, economic growth recovered to 4.0 percent in 2013, thanks to strong domestic demand. The outlook for 2014 and 2015 is more modest, with growth forecast at 3.5 percent, as domestic demand has slowed in the face of tighter global liquidity, domestic political uncertainty, and regional security risks. The recovery in Europe and the depreciation of the Turkish lira have helped in the adjustment of the current account deficit to 6.5 percent of GDP in June 2014, down from 7.9 percent at end-2013. Annual inflation increased to 9.5 percent in July 2014 from 7.9 percent at end-2013, driven partly by high food prices due to a drought, and significantly above the Central Bank of the Republic of Turkey"s (CBRT) 5 percent target. More adjustment will be needed to reduce external financing risks, and this may keep growth around 3-4 percent in the medium (two–three year) timeframe.
Markets have calmed down since the March 2014 municipal elections, but uncertainties remain. Weak emerging market sentiment in the wake of the U.S. Federal Reserve"s announced "tapering", as well as domestic political uncertainties due to street protests, a heavy electoral cycle, and a corruption scandal, pushed the Turkish lira down 29 percent between May 2013 and end-January 2014. Following a sharp monetary policy course correction (with key rates raised by 550 basis points [bps]) on January 28, and after a clear victory for the governing Justice and Development (AK) Party at municipal elections in March, Turkish financial markets calmed down, the lira appreciated, and the benchmark (two-year) bond yield eased. The CBRT cut the policy rate cumulatively by 175 bps between May and July, based on the downward trend in market rates across all maturities on the back of lower-risk premiums and moderating exchange rate pass-through. However, since end-July, the benchmark bond yield surged by 85 bps to 9.07 percent, and the lira depreciated to below 2.20 per U.S. dollar from 2.09, putting further pressure on the already weak inflation outlook.


To realize its underlying potential, Turkey needs to accelerate structural reforms and improve trust in its institutions. Turkey"s main assets include a young, dynamic population, a large domestic market, and a strategic location, combined with strong infrastructure and much improved public services. However, domestic and foreign investors remain deterred by unpredictability and a lack of transparency in the business climate, and a lack of trust in key institutions. An increase in business investment and innovation as well as in education and skills is needed to boost productivity growth and create enough high-productivity jobs to accommodate Turkey"s rapidly growing labor force. In the face of less favorable global conditions and remaining external vulnerabilities, the drivers of Turkey"s growth need to come from inside- a reform boost would do much to restore Turkey"s luster as one of the most dynamic emerging market economies…
EU Harmonization
The EU accession process has been a significant anchor for reforms in Turkey, but progress has slowed in recent years. Turkey has a deep-rooted, albeit complex relationship with the EU. Despite Europe"s economic difficulties since the global economic crisis, the EU is Turkey"s largest economic partner, accounting for around 40 percent of Turkish trade. Turkey has benefited significantly from deepening integration with the EU through the growing sophistication of both exports and imports and access to financing. Turkey became a candidate for full EU membership at the Helsinki summit in 1999. Accession negotiations began in October 2005, but progress has slowed in recent years in the face of a number of political obstacles (including relations with Cyprus). Both sides are making efforts to regain momentum. Following the June 2011 elections, the Government upgraded the institution that oversees EU accession into the new Ministry for EU Affairs. In 2012, Turkey and the European Commission (EC) launched a "positive agenda" to highlight areas of common interest and to advance economic integration with practical steps.
Out of the 35 chapters of the acquis communautaire, only 13 have been opened since Turkey"s negotiations began, and only one chapter -science and research- has been closed. In 2013, the chapter on regional policy was opened and a roadmap on visa liberalization was signed. However, changes to the judicial system and a tightening of controls over the Internet in the wake of a corruption scandal and the AK Party-Fethullah Gulen movement fallout drew sharp criticism from Brussels in early 2014, putting the renewed momentum in the accession process in late 2013 at risk…
Financial Sector
The Turkish banking sector proved resilient against the effects of the global financial crisis. Due to fundamental reforms carried out after 2001, as well as the thorough professionalization of banking and continued strong banking supervision since then, Turkey"s financial sector remains well capitalized and profitable. Turkey was the only OECD country in which no explicit or implicit public sector support was provided to the banking sector in the wake of the 2008-09 crises.

Since 2010, the monetary and banking authorities have introduced a wide array of macroprudential tools to manage credit growth and ensure financial stability in the context of Turkey"s exposure to volatile international capital flows…
Despite significant exchange rate depreciation and a sharp rise in interest rates, the Turkish banking sector is likely to remain resilient thanks to robust capital buffers and a healthy loan portfolio…
Deeper and broader financial markets will promote investment and competitiveness…
Competitiveness and Private Sector Development
Turkey is relatively well positioned in global competitiveness rankings, occupying 44th place in the 2014 World Economic Forum"s Global Competitiveness Index. Foreign direct investment (FDI) rose from just over US$ 1 billion in the early 2000s to an average of US$ 13 billion in the 2008-13 period. However net FDI inflows averaged less than 2 percent of GDP between 2002 and 2013, below China, Russia, Brazil, Mexico, Poland, Malaysia, and even smaller high-middle-income countries in Europe and Latin America. As a share of all FDI to emerging markets, Turkey today receives roughly the same as a decade ago, after significantly raising its share during the 2005-07 periods…
Bureaucracy and a lack of predictability with regard to the regulatory framework still hold investors back…
More reforms are needed for Turkey to escape the "middle-income trap". Many emerging markets have experienced a marked slowdown in growth when it is no longer possible to boost productivity by shifting additional workers from agriculture to industry and services. This structural change process has indeed been the main driver of productivity growth in Turkey. Close to exhausting the gains from structural change, the country now needs to boost productivity growth, both at the frontier -through innovation- and among SMEs, which account for nearly 80 percent of employment. Improving the business environment is key, especially for SMEs. Figure 5 shows the improvement, in percentage points, in the distance to frontier indicator for countries that ranked between 75 (Czech Republic) and 50 (Kazakhstan) in ease of doing business in 2014. The graph illustrates that Turkey was among the better improvers in 2014. However, in order to reach the goal of being among the top 50 countries by 2018 as expressed in the Tenth Development Plan, the country would need to accelerate the implementation of reforms.
Enterprise surveys suggest that access to finance, high taxes, and the remaining regulatory hurdles are the main obstacles facing SMEs. The surveys suggest that regulatory barriers are highest for SMEs, higher even than for micro-firms. At the same time, many SMEs also need to modernize their governance and introduce professional management to improve their ability to absorb and adapt new technologies…


Labor Markets
A major medium-term challenge for Turkey is to boost the participation of its youth and women in the labor force. Despite notable success in job creation in recent years, almost half of the Turkish working-age population (WAP) does not enter the labor market, mostly due to the low labor force participation (LFP) rate of women, which is around 30 percent, less than half the OECD average of 65 percent. About 35 percent of youth, mostly women are neither working nor attending school – the highest share of inactive youth among OECD countries. For the youth who do work, more than half (51 percent) work in the informal sector, compared to a population average of 36 percent.
Labor market rigidity and the high cost of labor are important constraints to job creation in Turkey. Among OECD countries, Turkey has the highest level of employment protection, particularly with regard to limited opportunities for temporary employment.


Turkey"s labor force is characterized by a low level of schooling, despite improvements in younger cohorts…
The mismatch between the skills obtained in formal education and those required by business is another obstacle for productive job creation…
Poverty and Social Protection
With rapid economic growth after the 2001 crisis, Turkey"s social outcomes have improved. Poverty decreased from 44 percent in 2002 to 21 percent in 2012.2 Other dimensions of well-being also improved significantly, and Turkey has already met the Millennium Development Goals (MDGs) for maternal and infant mortality (see below for a discussion on Turkey"s strong performance in the health sector)…
Large inequalities persist, however, and social mobility is still limited. Turkey"s Human Development Index (HDI) increased from 0.671 in 2005 to 0.722 in 2012, putting Turkey in the high human development group. However, Turkey"s inequality-adjusted Human Development Index (IHDI) -which adjusts for inequalities in health, education, and income measures- is 23 percent lower than its nominal HDI…
The Government has developed an integrated social assistance system geared toward helping welfare recipients get out of poverty…
The 2008 social security reform improved coverage of public pensions and is expected to yield significant savings, but these are insufficient to ensure pension system balance over the long term…
Education
Turkey has made significant progress in increasing access to schools. Turkey has achieved almost universal primary school enrollment (99 percent in the first four years and 93 percent in the second four years in 2012-13), and secondary enrollment was at 70 percent as of 2012-13…
In parallel with rising enrollment rates, Turkey"s average PISA performance scores have improved significantly, and inequality in student performance has declined…

Looking ahead, Turkey must build on its achievements to further expand quality and broaden access to good education for all…
I. Turkey knowledge program: results highlights
This is a selection of recently completed or ongoing studies, which are published and available on the Turkey World Bank website (www.worldbank.org.tr), and technical assistance projects, which focus on capacity building.
The report, "Turkey in Route to High Income: Lessons in Integration and Inclusion", contains the following key messages:
? Turkey is among a handful of countries on the threshold of high-income status (together with Mexico, Brazil, Malaysia, and several new EU member states). How it got there and where it is headed from here hold important lessons for other emerging markets (EMs).
? Turkey"s growth has been shared. In 2002-11, poverty (measured as consumption below US$ 5 per day in purchasing power parity) declined by half from 43 to 22 percent. Growth in consumption of the bottom 40 percent averaged around 5 percent in the same period, marginally below the average for the country.
? Turkey"s economic and social progress has been led by the private sector. The Government has played a supporting role through establishing a sound regulatory framework and investing in public services and infrastructure. Government redistribution has not been a major factor.
? In a less accommodating international environment, Turkey faces major challenges to sustaining economic growth and overcoming the "middle-income trap". The priorities include: (i) sustaining productivity growth through reforms of the business climate to attract more FDI and encourage innovation, (ii) boosting women"s participation in labor markets to fully benefit from the demographic dividend, (iii) deepening institutional reforms to strengthen the rule of law, increase transparency, and build greater trust.
Lessons in Integration and Inclusion:
? Six main drivers of economic and social progress are identified in the report:
1. Opening up to trade in the 1980s and closer integration with the EU after the Customs Union agreement entered into force in 1996
2. Reforming the financial system to reorient it from government to private sector financing and making it stable enough to withstand global capital inflow volatility (even though this is an unfinished agenda)
3. Reallocating labor from unproductive agriculture to more productive manufacturing and services, mostly as a result of private sector entrepreneurial activity
4. Supporting structural change through infrastructure and housing investments that made Turkey"s growing cities the main engines of economic growth and improved access to public services
5. Overcoming a lackluster labor market to generate an employment miracle of an additional 4 million jobs since 2009) after the global economic and financial crisis, in part through targeted reductions in labor taxes on women and youth
6. Using the room created by successful fiscal stabilization after 2001 to expand spending on health care and education while improving quality, thereby starting to close the performance gap with other OECD countries
? The first three drivers provide Turkey"s lessons in the benefits of economic integration with Europe and with the world economy. The second three demonstrate the value of shifting to a more inclusive growth model, working with and not against the forces of structural change and building on a strong fiscal foundation.
World Bank – Trading up to high income – Turkey country Economic Memorandum
May 2014
Executive Summary
Strong export growth combined with increased diversification
1. Turkey"s export performance since 2002 has been strong. Amid a conducive global environment, progress in advancing structural reforms domestically, and with more productive companies, merchandise exports increased from US$ 36 billion in 2002 to over US$ 150 billion in 2012. Exports grew 15 percent a year on average in dollar terms, more than six percentage points above the average global growth of exports, and as much as the pace of expansion in Brazil, Russia, and India.
2. Turkey diversified both its export markets and its export product mix.
• Markets. Turkish exporters substantially broadened their market reach, exporting to 137 countries at present, up from 90 in 20001. Since the global financial crisis, amid a sluggish expansion in demand in traditional markets, the share of Turkey"s exports to the European Union (EU) and the European Free Trade Association (EFTA) declined, while that of Middle East and North Africa (MENA) and other markets rose. These changes notwithstanding, the EU remains Turkey"s key trading and investment partner. It is companies that exported to the EU that led the expansion of exports to MENA, drawing on their experience in serving a demanding client. Moreover, the spillovers from the strong trade and investment relationship with the EU -including of technology, management and marketing expertise- are essential for generating solid value added and helping upgrade Turkey"s export basket.
• Products. The composition of Turkey"s export basket changed significantly over the past decade, as the economy is moving increasingly to capital-intensive and institutions intensive products from those intensive predominantly in inexpensive labor. Turkey entered the decade highly reliant on apparel exports. Over time, the importance of apparel declined dramatically and was overtaken around the middle of the decade by the automotive sector. More recently, products of the metals, machinery, and, to a lesser extent, agri-food industries have taken a prominent position in the export basket. Exports of chemicals, particularly plastics, have also been rising in the last few years.
Turkey"s export competitiveness has improved
3. Much like its economy, Turkey"s exports have become more globally competitive. Turkey"s global market share rose substantially from 0.55 percent of global imports in 2002 to 0.82 percent in 2012. Increased competitiveness of firms supported by measures to streamline the business environment, improve infrastructure, connect the country domestically and internationally, has been a key feature of the last decade. Export competitiveness is "the degree to which, under open market conditions, a country can produce goods and services that meet the test of foreign competition while simultaneously maintaining and expanding domestic real income". Measures of export competitiveness include firms" market share, the level of complexity or technology content of exported products, and the ability of firms to charge higher prices for similar products due to higher quality perception.
4. Export sophistication, an important measure of export competitiveness, improved through 2007. Turkey"s export sophistication increased almost 20 percent between 1997 and 2007, eased until 2009, and picked up again since then. The increasing importance of mid-tech exports (mainly automobiles and auto parts) played an important role in the evolution of Turkey"s export sophistication as they replaced less sophisticated products (garments and textiles) as the top export sectors and allowed the country to narrow the "sophistication gap" with countries such as Poland and Mexico until 2007. The decline in export sophistication after 2007 can at least partially be attributed to the commodity price boom of 2008, but was also impacted strongly by the decline in automotive and other mid-tech exports to the EU.
5. The quality of exports also improved. In 2002, the absolute majority of exports (64 percent) was concentrated in products which were sold at a unit price in the bottom third of the price distribution compared to the price of all competitors selling to the same destination market. By 2010 the majority of products were sold at the middle or high end of the quality range. Export quality has improved remarkably in particular in those sectors where quality standards matter most, such as machinery. Exporters with higher quality of exports are more likely to survive in export markets.
Turkey wants to further strengthen export performance
6. The authorities" ambitious development vision for 2023 includes a prominent role for its exports. Turkey aims to become one of the ten largest economies in the world by 2023, with per-capita Gross Domestic Product (GDP) rising to US$ 25,000 and exports to US$ 500 billion. Turkey has a success story to build on, as evidenced by its impressive reforms since 2001 and its quick rebound from the global crisis. Size, geographic location, excellent connectivity to East and West, and a young labor force are also key factors that will contribute to success. Still, all key structural features of Turkey"s economy will need to be fit for premiere league standards if the country is to succeed. This report focuses on Turkey"s competitiveness from the supply side, but it is important to note that ensuring a more balanced mix of financing for the required investment through measures to boost domestic savings is equally important if Turkey"s progress is to be sustained.
7. Achieving Turkey"s export target is possible and it will likely require a larger global market share. With the recent slowdown of growth in both in advanced and emerging economies, Turkey may not benefit as much from the "pull" of growing global demand as it did over the past decade. Thus, achieving continued rapid export growth and reaching the government"s export targets will require a significant increase in Turkey"s global market share. This, in turn, means that exporters need to become more competitive by producing goods at more attractive prices – or at higher quality, expanding their product range to faster growing product segments, and improving quality and technological sophistication to command higher prices in export markets.
Accordingly, this establishes the critical importance of competitiveness for the Turkish export sector and sets out an agenda that is based on continued substantial increases in productivity driven by innovation and focused on quality.
There are plenty of challenges
8. Despite high export growth, exports have not been the main driving force of rising incomes in Turkey over the last decade. The ratio of exports to GDP rose from 20 percent in 1998-2000 on average to about 23 percent by 2009-2011. This increase is smaller than in most relevant comparators at a similar level of development except Russia. Exports to GDP increased by about 10 percentage points in the EU125 over the same period, 11 percentage points in India, and 9 percentage points in China.
9. Turkey has specialized in mid-tech sectors which have experienced relatively slow growth in global demand. Although Turkey"s exports are one of the most diversified among middle-income countries, they are dominated by goods and sectors that have experienced only modest growth in global terms. In addition, while Turkey has dramatically increased its medium-technology exports, it stagnated in high-tech exports. Indeed, relative to peers, Turkey"s product composition has exerted a strong downward bias on export growth. In other words, Turkey lacks a comparative advantage in higher growth products. Since these products are relatively distant to the country"s current export basket there are few low cost opportunities for Turkey to shift to a more dynamic export composition. Changes in the export basket will require investments and the upgrading to Turkey"s skill base, as explained further below.
10. However, there is strong potential for Turkey to move up the global value chains (GVC). Turkish companies in key sectors of the economy have successfully integrated into GVC and Turkey"s presence in GVC is stronger than in comparators such as Mexico and Brazil. Although Turkey seems to specialize in assembly and low value added segments of GVC, the country"s presence is strongest in sectors with longer than average value chains, representing an important opportunity for upgrading along the chain. Furthermore, Turkey meets an important pre-condition for effectively attracting value-chain related activity. Namely, its trade costs are low and its logistics infrastructure is well developed, particularly when the country is benchmarked against competitors with similar income levels.
11. The relatively low level of Foreign Direct Investment (FDI) in Turkish manufacturing has been a constraint to export growth and quality improvements. Limited inflows of FDI will hamper Turkey"s ability to benefit from the technology and knowledge spillovers from firms likely to be close to the technology frontier and thus move up the value chain. A conducive business environment is an important determinant of FDI, and Doing Business indicators suggest Turkey (ranked 69th) does not compare favorably with many of its competitors. A recent survey of foreign investors suggests the main barriers to larger inflows of FDI in Turkey are microeconomic: tax and incentive policies, lack of legal assurance, and the unregistered economy are the top three factors. Innovative capacity and adequate work skills are also factors that will play a key role in attracting foreign investors.
12. The relatively poor export performance of Turkey"s SMEs is one of the main constraints to the growth and upgrading of exports. Turkey"s firm distribution reveals a surprising lack of dynamism among Turkey"s mid-sized firms, in terms of exports as well as productivity growth – a phenomenon this Report calls the "Missing Middle". Export growth has been driven strongly by the large (and growing) firms that operate at a substantial productivity premium over the majority of exporters and domestic producers alike. These large firms are driving both intensive and extensive margin growth and are increasingly pulling away from the rest of the economy. At the same time Turkey"s export growth is driven almost exclusively by the intensive margin, as new entries (firms, products, and markets) have not delivered sufficient growth to offset corresponding losses of old firms, products, and markets. On the one hand, this indicates that Turkey"s established exporters are becoming increasingly competitive. On the other hand, it also means that there may be a problem of access to exporting and export survival for smaller firms. Helping small firms to become dynamic, sustainable mid-sized exporters may be important, as improved performance at each of the extensive margins is likely to be critical to Turkey"s future growth. In addition, as human capital intensive services become increasingly important for growth, a dynamic SME sector is likely to become even more important, as evidence from advanced economies suggests.
13. The performance of the services sector has lagged behind competitors. Turkey"s services exports have been sluggish during the last decade, in particular with respect to commercial services excluding travel and transport services. Exporting competitive products depends not only on access to raw material inputs but also on critical services inputs. These include efficient, competitively priced utilities, cost efficient financial services, and other commercial services. While manufacturing accounts for 72 percent of the gross value added in 2007, its share falls considerably when forward and backward linkages to the service sector are considered. This highlights the embedded value of services inputs to manufacturing exports and underlines the importance of a competitive services industry. Commercial services transport and distribution services are particularly important. Turkey"s services sector is subject to a wide range of regulatory restrictions, including on entry and price-setting, that hamper competition. A significant decrease in relative regulatory restrictiveness in services is likely to yield substantial gains in value added in service-intensive industries. Integration with the EU in the area of services would also pay off in terms of raising the sector"s competitiveness.
14. While Turkey has substantially liberalized its trade regime, its use of trade policy flexibilities may negatively affect trade flows and resource allocation. In line with the large scale and frequent use of trade policy flexibilities by many countries, Turkey is also exercising flexibility through temporary trade barriers (TTBs) such as antidumping, safeguards and countervailing duties. The list of major import products that are subject to TTBs (including textiles and apparel, metals and electrical machinery) presents some cause for concern regarding Turkey"s industrial competitiveness, since most of these are applied to key industrial inputs. New import restrictions on inputs impose higher costs on domestic downstream industries in Turkey and work to decrease the competitiveness of these industries. Moreover, difficulty in accessing quality inputs may also have a potential impact on the quality of exports, as suggested by the analysis of the determinants of export quality. Finally, if the industries further down the value chain are also protected by new import restrictions, competitiveness suffers through "cascading contingent protection". This potential negative impact on competitiveness is largely mitigated by the inward processing regime under which key inputs imported for production of exported goods are exempt from trade remedies. In 2013, 44 percent of exports fell under this regime.
An effective policy agenda for competitiveness needs to focus on productivity
15. Raising export growth to levels that help meet Turkey"s development goals will require a policy agenda that targets sustained further improvements in Turkey"s physical, human, and institutional capital. This "asset" foundation of the economy ultimately drives economic development. Boosting the quality, cost competitiveness and range of exports is mainly the result of constant upgrades to the country"s assets. Recent cross-country quantitative assessments of the main determinants of export diversification show that market access, infrastructure, human capital, and the quality of institutions positively and significantly affect the level of export diversification most of which are also relevant for the competitiveness discussion presented in this report.
16. Upgrading the existing export basket is unlikely to benefit measurably from policies that "pick winners" among products and sectors. Instead, addressing the factors that limit productivity growth will be key to success. Consequently, this report prioritizes broader policies that are fundamental for Turkey to export its way out of middle-income. Chief among these are policies that: (i) link the country further with international markets, including by helping bring larger inflows of FDI, particularly into the manufacturing sector; (ii) promote innovation, including by encouraging a large role for private companies in research and development (R&D); (iii) upgrade the skills both of the existing work force and new entrants; and (iv) improve access to finance, particularly long-term, with a view to unlock the potential of the dynamic SME sector. While these policy areas are the ones most directly relevant for enhancing productivity and upgrading export quality, there are other reforms, particularly in the context of improvements to investment climate that would also contribute to upgrading the export basket.
17. Technology upgrading, innovation, and experimentation by large and medium-sized firms hold the key to upgrading exports. Nominal export growth is important, but ultimately it is value added growth that matters. Analysis indicates that technology upgrading and absorption is an important determinant of value added growth and that primary channels for these are FDI, import of intermediates and investment in R&D. Among other benefits, technology upgrading and absorption allow for the production of more sophisticated and higher quality goods, which generate higher value added. Medium and especially large firms have driven product diversification and quality in recent years, and will continue to be in the best position to invest in research and in innovation more broadly. This will encompass investment in R&D to improve capacity for innovation and technology absorption. Moreover, there exists significant potential for spillovers of technology adoption to SMEs as well as reputation effects from investments in quality and branding for Turkey"s leading companies. At the same time, it is apparent that Turkey has far from exhausted its potential to attract FDI, despite the significant increase in inflows over the past decade. A coordinated strategy to make Turkey more attractive as an investment destination for multinational companies as well as for innovation by domestic industry leaders would go a long way towards delivering the upgrading of Turkey"s technological capabilities to premier league level.
18. Higher value added exports will require more skilled labor, particularly as the global digitalization leads to a decline in the relevance of labor-cost advantage. Firms with a higher share of staff with university education and relevant skills tend to show higher productivity, according to the analysis carried out in the Turkey 2010 Investment Climate Assessment (ICA). Survey results show that larger firms are in a better position to afford skilled staff with university education, which contributes to larger firms" better export performance compared to mid-sized firms. A more educated workforce, essential to adopting new technology, is also likely to attract higher foreign investment into the country, as suggested by the analysis of the global value chains. As a result, upgrading the skills set of the workforce is an important element of moving up the value added ladder in exports. Nearly a quarter of Turkish firms rate the education and skills levels of the workforce as a major or very severe constraint on operations and growth. The low level of skills of the working age population (particularly for women), the increasing demand for skills, and the demographic dividend make skills particularly relevant in Turkey. Improving the quality of education through the school cycle is the most cost-effective measure to enhance productive employment over the long run. In addition, enhancing the skills of the existing labor force is also crucial.
19. Firms of all size categories perceive access to finance as the single most severe obstacle to expanding business. Medium-sized firms appear to be particularly affected, with a third of these firms citing lack of finance as a constraint. Medium- and long-term financing is particularly scarce and high collateral requirements or credit rejection rates prevent many SMEs from realizing investments to upgrade or expand their facilities. The access of SMEs to long-term finance can be improved through consistently stability-oriented macroeconomic policy and reforms of the institutional environment for credit markets, including insolvency legislation and a more efficient framework for secured transactions. The ability of financial institutions to assess the creditworthiness of SMEs can be supported through improved credit information, enforcement of transparent financial reporting standards and technical assistance to improve the ability of SMEs to present investment and business plans. Leasing products and private equity are also potential instruments which could better serve SMEs" financing needs.
20. The following table provides more specific policy recommendations, some of which rely on other World Bank studies…
2. Exports, Exporters and Partners
11. Turkey"s export performance over the last decade has been strong. During this period, Turkish exports gained an increasingly bigger share of the global import demand, up from 0.55 percent in 2002 to 0.83 percent in 2012. Market diversification towards non-traditional markets, particularly at a time when the EU suffered from weak demand, paid off. At the same time, the shift in the product composition led to an increased level of sophistication. Moreover, the quality of Turkish exports also improved. The country developed revealed comparative advantage in new products such as road vehicles and on the whole demonstrated a larger degree of export diversification than many of its Brazil, Russia, India, China and South Africa (BRICS) peers.
12. What countries produce and how they produce it matters for export growth. Simply put, to ascend to high income status, Turkey needs to shift into producing and trading more high income goods and services, and perhaps even more importantly, move up the value chain in those sectors in which it is already specialized.
Over the past decade, while Turkey dramatically increased its medium-technology exports, the increase in its high-tech exports was not as strong. Furthermore, the quality ranking of Turkish exports remained low -especially in EU markets- despite significant improvements of late.
13. Turkey"s good export performance has not been shared widely across the spectrum of firms. While the number of mid-sized firms increased during 2003-08, their contribution to exports decreased significantly.
The analysis suggests the underlying cause is the low and declining productivity for this group of firms. This weak performance is likely to be a result of significant barriers, such as a taxing regulatory environment, which disproportionately affect mid-sized firms. Spreading export success more widely will be key to boosting export growth on the extensive margin going forward.
14. This chapter starts with a snapshot of Turkey"s exports and exporters with a focus on three dimensions; markets, sectors (products) and firms. The chapter introduces the concepts of trade margin, export sophistication and export quality before proceeding to assess Turkey"s export competitiveness as measured by these indicators. Agriculture trade is then discussed in more detail. The chapter ends with introducing the problem of "the missing middle" – i.e., the underperformance of mid-sized firms according to their contribution to exports, driven by low and declining productivity.
Overview of Exports
15. Exports grew rapidly after 2001, with a temporary decline in 2009. Exports grew at a double digit rate every year until the global financial crisis in 2009. Following a decline of one-fifth in 2009, exports recovered in 2010 and accelerated in 2011-12, moving well beyond the 2008 peak and passing the US$ 150 billion mark (Figure 1 and Figure 2). Overall, exports grew by a factor of four, or 15.3 percent annually, during the 2000s. To put this into perspective, Turkey"s export expansion during the past decade was more than 6 percentage points above the global annual average growth of exports, more than twice that of Organization for Economic Cooperation and Development (OECD) countries, and only 4 percentage points below that of China.
16. The sharp export expansion notwithstanding, Turkey"s trade rose only modestly relative to GDP during the last decade. Imports grew significantly, with the trade deficit widening over the decade (Figure 3). But while Turkey did increase imports 50 percent faster than the world average and 75 percent faster than the OECD average, this increase was far less than in other emerging market economies which experienced a dramatic expansion of their integration into global production networks. For example, Turkey"s rate of import growth was only half the rate observed in China over the decade. At the same time, Turkey"s GDP measured in US dollar terms tripled over the past decade as the real exchange rate appreciated. Consequently, the ratio of trade to GDP increased by only 5 percentage points from 1998-2000 to 2008-2010, the smallest change among all comparators with the exception of Russia. Overall, Turkey"s trade volume-to-GDP ratio is broadly in line with its BRICS comparators, but far below that of smaller neighbors at similar levels of development (Figure 4).
17. An increase in a country"s exports can be due to rising global demand or to improvements in competitiveness. For policy purposes, it is useful to decompose these two factors. Assuming that Country A is "more competitive" in trade than Country B simply because its exports are growing faster is simplistic. Even using relative performance in terms of market share, growth may be prone to misinterpretation. This is because export growth is influenced by "pull" (or compositional) effects and "push" (or performance) effects (Table 2). Two countries may actually have similarly competitive bundles of export firms, but overall export performance of one country will be higher than the other in the short-to-medium term because it has a more favorable (at the time) composition of exports, in terms of both geographical markets and sectors. What does decomposing exports in this way say about Turkey"s export competitiveness in recent years?


18. Competitiveness played a bigger role in driving exports before the crisis, but pull factors became more dominant after 2009. The analysis provides three key findings. First, until the crisis Turkey clearly outperformed global export growth, but during and after the crisis (2010) growth fell below the average. Second, until the crisis, competitiveness (or "push" effects) played the biggest role in driving export growth before giving way to "pull" factors during and after the crisis. Third, going forward, Turkey"s greatest challenge in increasing export growth may be due less to the geographical composition of its exports and more to the sectorial composition. In other words, Turkey needs to move into products for which global demand is growing fast.
19. Turkey"s trade competitiveness compares favorably to that of its major peers. Table 2 shows that Turkey"s export performance stripped of compositional effects during the period 2005-2010 is relatively strong, trailing only China and India among the peer group. The negative effect of Turkey"s sectorial composition is clear, while the geographical contribution to growth is higher than in any peer country other than Brazil. This seems to run counter to the conventional wisdom that Turkey has a market problem that must be addressed, for example by shifting away from the EU. Instead, it suggests that the problem is more one of the sectors in which Turkey"s exporters compete, and their position within these sectors. Looking at the "push" or performance factors, it is clear that Turkey has grown well on the back of volume growth, while price has played a relatively minor role.

20. However, Turkey"s export gains were mostly the result of existing firms selling more of the same products. A de-composition of export growth on the intensive and extensive margins provides an important indicator of a country"s competitiveness. Specifically, one can look at whether export growth is the result of existing companies exporting more of their current products to existing markets (the "intensive margin"), or whether exports increase because new firms enter, new products are exported and new markets opened (three dimensions of the "extensive margin") (Table 3). Such a de-composition reveals that the "intensive margin" accounted for nearly two-thirds of export growth in 2002-2011 (Figure 5). By contrast, new markets accounted for 15 percent, new products for 9 percent, and new firms for 11 percent. This is in line with the analyses in Aldan and Çulha (2013), which suggest the increase in the extensive margin of exports during 1993-2011 mostly comes from entering new markets.


21. A high reliance of export growth on the intensive margin is not unusual for a country at Turkey"s stage of development. Figure 6 compares Turkey"s share of export growth on the intensive margin with countries across a range of development levels and geographies. The data suggests there may be a decreasing contribution of the intensive margin at higher stages of development, as companies close to the technology frontier need to innovate more to remain in business, producing a diversified set of goods and services, and firms move beyond local and traditional markets. For example, the extensive margin accounted for 60 percent of France"s export growth over 2002-2007, of which 27 percentage points was accounted for by the replacement of less efficient with more efficient firms, 20 percentage points from new market entry and the phasing out of slow-growing markets, and 13 percentage points from focusing on exporting new and higher value products (Bricongne et al. 2011). For commodity exporters, this experimentation may be slower and the relative contribution from the intensive margin higher. Indeed, this is what emerges from the scatter-plot, where the countries who rely most on the intensive margin are all significant exporters of commodities, with the notable exception of Turkey…

Destinations of Turkish Exports
24. Turkey significantly diversified its export markets over the last decade. Although the EU remained Turkey"s most important trading partner, Turkish products entered many new markets. Indeed, relative to the BRICS, Turkey had the second highest level of market concentration of exports in 1999, while a decade later it was one of the most diversified. Over this period, Turkey"s index of export market concentration halved (Figure 8). Turkey"s exporters also substantially increased their market access, with significant levels of exports now going to 137 countries (Figure 9). This puts Turkey broadly in line with BRICS peers and far ahead of regional ones.

25. Diversification of Turkey"s export markets has been an outcome both of a long term, steady expansion of exports to non-traditional locations and the major shock from the global economic crisis and economic problems in Europe. As Figure 10 shows, the EU remains by far Turkey"s largest trading partner, but its relative importance is clearly in decline, with MENA gaining more prominence. While export growth to all regions declined during the crisis, the decline in exports to the EU-27 and the US started earlier, was more pronounced, and lasted longer than the decline in exports to other regions. Even after the rebound in exports in 2010, the value of exports to the US and EU-27 is about 10 percent lower than in 2007 while exports to MENA and Asia are more than 50 percent higher than in 2007. As a result, between 2007 and 2010 alone, the EU-27 share of Turkey"s exports declined by more than 10 percentage points, from 59 percent to 48 percent. The biggest winners from this shift were MENA (whose share grew from 16.7 percent to 25.1 percent) and Asia (from 6.5 percent to 9.4 percent). As a result of aggressive market diversification, Turkish exporters" market share in MENA has almost doubled to over 5 percent (Figure 11). The US, meanwhile, continued its long-term decline in importance (linked more to the end of the Multifibre Arrangement in textiles than to the economic crisis), shrinking to only 3.3 percent of Turkey"s exports…
(The group of MENA countries includes: Algeria, Djibouti, Egypt, Iran, Iraq, Jordan, Lebanon, Libya, Morocco, Syria, Tunisia, and Yemen)


27. Turkey exports different products to MENA and the EU. Exports to the EU-27 are dominated by vehicles and textiles (Figure 12 and Figure 13). These sectors had divergent trends during the past decade, with textiles in decline and automotive exports in ascendancy, the latter linked with increasing FDI and the integration into regional production networks. Exports to MENA are dominated by metals and to a lesser extent by machinery and textiles. In MENA, both vehicles and textiles declined in importance over the last decade, while metals increased their importance. In fact, metals alone accounted for one quarter of all growth in Turkish exports to MENA between 2006 and 2010 (in 2008, it accounted for half the growth and in 2009 for more than 60 percent of the decline). On the other hand, the shift in relative importance of destination markets is not simply explained by sectorial composition effects. The shift from the EU towards MENA is taking place across all sectors…


29. There has also been a significant change in the sectorial composition of Turkey"s exports over the last decade. The share of the textile and apparel sector, which accounted for 40 percent of exports at the beginning of the decade, declined dramatically (Figure 15). It was replaced in particular by the automotive sector, which grew rapidly during this period, but also by the machinery and metals sectors. This decade-long pattern of structural transformation slowed from 2007, however. Indeed, while the crisis triggered significant shifts in Turkey"s export basket from a market perspective, it coincided with a period of relative stagnation from a sector and product perspective, although there was some rise in metals and decline in automotive at the height of the crisis. Export growth after the crisis has been less dependent on vehicles and transport equipment and more dependent on metals, machinery, and textiles, as well as sectors outside the traditionally strong ones. The vehicles sector was the most affected by the crisis and the slowest to recover from it. The food and beverages sector, by contrast, showed resilience to the crisis, and has contributed more to growth after the crisis than the automotive sector.

30. Accordingly, Turkey developed revealed comparative advantage in new sectors (Table 4). Turkey maintained revealed comparative advantage (RCA) in a number of resource-based export sectors including those related to metals (e.g. iron and steel), agricultural products (sugar, tobacco, fruit and vegetables), as well as in textiles, and some chemicals. The country also developed RCA in road vehicles, dying, tanning, and coloring of materials. However, most of the products that had the highest RCA in 2000 experienced declines in RCA over the decade – all of the top 5 RCA products and 8 of the top 10 had lower RCA in 2010 than in 2000. The products with the highest growth in RCA over the decade included: fertilizers; sanitary, plumbing and lighting fixtures; non-ferrous metals; furniture; road vehicles; dying, tanning, and coloring of materials; and power generating machinery and equipment…

40. Europe remains the single most important destination for Turkish exports, despite a recent shift to MENA. About 30 percent of all agricultural exports in 2010-12 were destined for Europe (Figure 21). However, in the past five years exports to MENA have surged and the region accounted for nearly 30 percent of agricultural exports in 2010.

41. A change in product composition also accompanied shifting geographic orientation. Figure 22 shows the composition of exports, categorized by the type of processing involved. The first category includes unprocessed cereals, like wheat and barley, and lightly processed animal products, like wool and fresh meat. Processed goods include products like flour, juice, pastry, dried meat and hides. Fresh horticultural goods, and nuts and spices are listed separately, since the items included in these two categories often require special handling akin to processing…

59. In the wake of the prolonged crisis in the EU, a lot has been made of Turkey"s successful export market diversification as a key risk mitigation strategy. This is true to some extent. To see how much, we estimate the vulnerability of Turkey"s exports to a GDP contraction in foreign markets. As Table 6 shows, Turkey is indeed most vulnerable to a contraction of GDP in the EU, because the EU still accounts for the largest share of Turkey"s exports. However, the elasticity of Turkish exports to a change in GDP in MENA is in fact higher (0.84 as opposed to 0.79 for the EU). Were Turkey to increase the share of exports to MENA to the current share accounted for by the EU, its vulnerability would actually increase. Moreover, import demand has become much more highly correlated across global markets, due in a large part to the expansion of integrated value chains. This suggests that market diversification may be a less effective strategy to reduce risk than it was in the past…
66. The distribution of Turkey"s exports in aggregate are roughly in line with what one would expect. A gravity analysis, as the one employed above to look at the vulnerability of Turkey"s exports to changes in economic conditions in partner countries, can also be used to estimate whether there are unexploited opportunities to expand exports to particular markets. At the aggregate level, no such unexploited opportunities in bilateral trade exist. However, the index of export market penetration, a measure of the effectiveness of export market reach relative to a country"s export basket, indicates that while Turkey compares well over time and with peers, its exporters still reach only 30 percent of potential markets (Table 7). This is only half the level of market penetration achieved by China (which, along with Germany, is the highest in the world). So there are likely to still be unexploited market opportunities within specific sectors and products. Note that Turkey has much deeper penetration of MENA markets than it does in EU markets. Overall, Turkish exports account for 4.3 percent of all imports in the MENA region versus only 1.1 percent of imports to the EU region. In fact, for all of Turkey"s main export sectors with the exception of automotive, market penetration is already higher in MENA than in the EU…


72. Individual exporters are not shifting from declining to growing sectors. Intra-firm shifts between sectors at the HS2 level of aggregation were minimal during 2002-2011, accounting for less than one percent of export growth in any year. It seems the shifts in the sectorial composition of exports were largely the result of different growth dynamics of firms in these sectors. First, existing (mainly large -with more than 200 employees) exporters in the emerging sectors have grown faster than firms in traditional sectors. Second, the entry of new exporters increased in the emerging sectors but slowed in the traditionally strong sectors. This is shown clearly in Figure 32: for example, export entry declined by almost 20 percent in the clothing sector and 11 percent in textiles between 2003-2004 and 2009-2010, while it grew by more than 13 percent in mechanical machinery, more than 18 percent in electrical machinery, and almost 38 percent in vehicles and auto parts…

Turkey"s use of temporary trade barriers
82. By the 2009 global crisis, Turkey had developed a relatively liberal trade regime. The set of standard indicators presented in Table 8 are revealing. In 2007, Turkey"s trade-weighted applied tariff on manufacturing products was only 1 percent, and its simple average applied most favored nation (MFN) tariff was only 4.8 percent. More comprehensive and economically meaningful indicators such as the trade tariff restrictiveness index (TTRI) or the overall trade restrictiveness index (OTRI) were also quite low for Turkey during this period.
83. Turkey has made substantial trade policy commitments outside of the World Trade Organization (WTO) system through its Customs Union with the EU. Turkey"s MFN applied rate and the share of imported products subject to tariff lines are below those allowed under its WTO commitments. However, following the establishment of the Customs Union between Turkey and the EU, overall tariff rates declined significantly. First, two-way trade between Turkey and the EU is effectively duty free. Second, Turkey has sequentially adopted many of the other FTAs that the EU has negotiated with third countries, thus also extending preferential tariff access to these trading partners. Combined, nearly half of Turkey"s overall exports are to countries with which Turkey has signed an FTA or is in a customs union, referred jointly as PTAs. This implies that the trade policy indicators that take into account Turkey"s tariff preferences will reveal Turkey as being even more open than the indicators of its MFN policies in isolation, given that so much of its trade is with PTA partners…

84. In line with the large scale and frequent use of trade policy flexibilities by many countries, Turkey is also exercising flexibility through temporary trade barriers. Applications of these flexibilities have led to deviations from a truly common external tariff (toward PTA non-members) otherwise specified by the customs union with the EU. In particular, Turkey has even exercised flexibility by changing some of its applied trade policies toward PTA partners. More formal flexibilities include Turkey"s increasing use of TTBs.
85. A significant share of Turkey"s imports is affected by trade barriers. Turkey has accessed various institutional "exceptions" during 2008-11 to implement new trade barriers. Recent increases to applied tariffs in the textiles and steel industry alone may affect up to 9 percent of Turkey"s manufacturing imports. Data from the World Bank"s Temporary Trade Barriers Database indicate Turkey"s antidumping and safeguards in effect by 2011 impact another 4.4 percent of Turkey"s imports. Overall, Turkey had 127 antidumping measures,
10 safeguard measures and 1 countervailing measure in effect at the end of 2011. While implementing new import restrictions through the "exceptions" permitted by the WTO and PTAs may be in line with international rules, the economic impact weakens in part the effectiveness of Turkey"s relatively low applied import tariffs.
86. The list of major import products that Turkey covers with TTBs presents some cause for concern regarding Turkey"s industrial competitiveness. Turkey applies TTBs to import products in a number of different industrial sectors, including sizeable shares of imports in textiles and apparel, metals, electrical machinery, plastics and rubber, and stone and glass (Karacaovali, 2011). Table 9 presents a ranking of Turkey"s "top 10" TTBs in effect in 2011 by the estimated size of impacted imports. While the list does contain examples of TTBs applied to end-consumer products (e.g., footwear; travel goods, handbags and similar containers; made-up textiles) most of these major TTBs are applied to key industrial inputs. Important examples include multiple TTBs involving cotton or synthetic yarn or fibers, and industrial chemicals and plastics (MEG, PVC, and PET). New import restrictions on inputs impose higher costs on domestic downstream industries in Turkey and work to decrease their competitiveness. It negatively affects the ability of Turkish firms to compete in both the domestic market against imports from other foreign competitors and in third markets as exporters…

Barriers faced by Turkish exporters
91. Overall, Turkey"s exports do not seem to face significant TTB barriers abroad. Antidumping and other TTBs are currently not major causes of concern for Turkey"s exporters. Only roughly 0.1 percent of Turkey"s exports have been the subject to these forms of barriers since the 1990s, albeit most recently at a higher level of 1 percent of exports in 2012.
92. However, exports of certain products to certain destinations may face significant barriers. This was noted in particular with respect to apparel and food exports to some countries in MENA, and automotive exports to Latin America. Table 10 presents the average tariffs faced by Turkish exporters in the country"s top destination markets…

 Página anterior Página anterior | Volver al principio del trabajo | Página siguiente  |